
SudokuWiki.org
Strategies for Popular Number Puzzles
Microsoft Access Database Gallery
Access is a brilliant program for designing database front-ends - not just as a data storage medium. Many of these apps use SQL server or Oracle and interface with other Office programs such as Excel. Most of these applications are available for demonstration in person on my laptop. I am the sole author of each example but the requirements were set by each client as a real world project.
Office 2010 products used and developed in 2011 and 2012
Moray Offshore Renewables - Installation Strategy Tool
Office 2010 products used and developed in 2011 and 2012
Users enter details about ports and different suppliers. They can choose different weather data sets and then apply delays to each installation activity such as delivery of components to installation of parts. The model allows six different senarios which are combinations of on-shore and off-shore manufacture and installation. The variability comes defining the capacity of different ships.
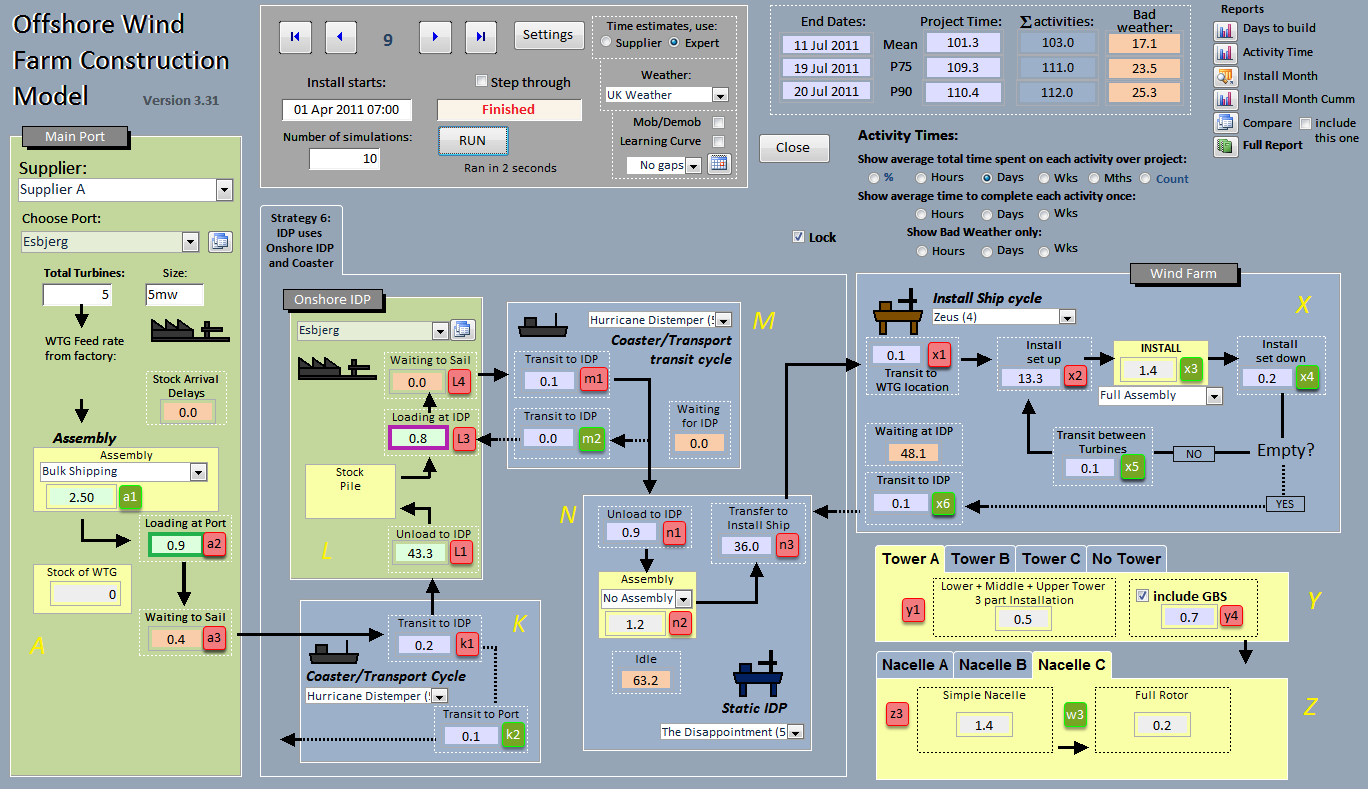
This is the main model screen. One can "step" through each tick of the model cycle to see how individual elements are related and are obliged have to wait (time impact study) for other activities. The purpose is to find bottlenecks in the design of the installation plan. The once everything is set up the model can be run - usually for about 1000 to 5000 times. This gives a good statistical spread of the schedule.
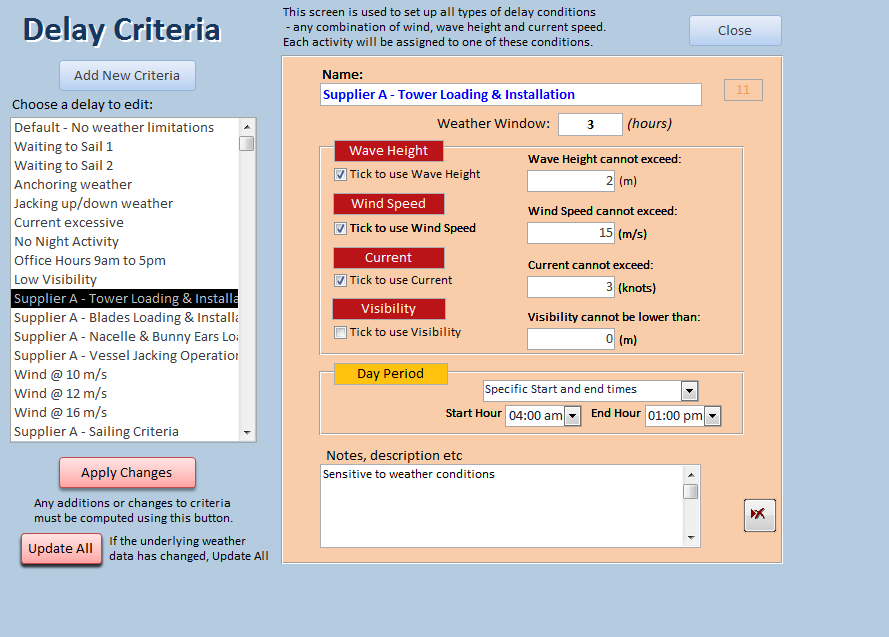
Each activity in the model will be set a certain criteria which if exceeded will stop the activity. These are usually weather senstive conditions but the activity can be specified to be day or night only.
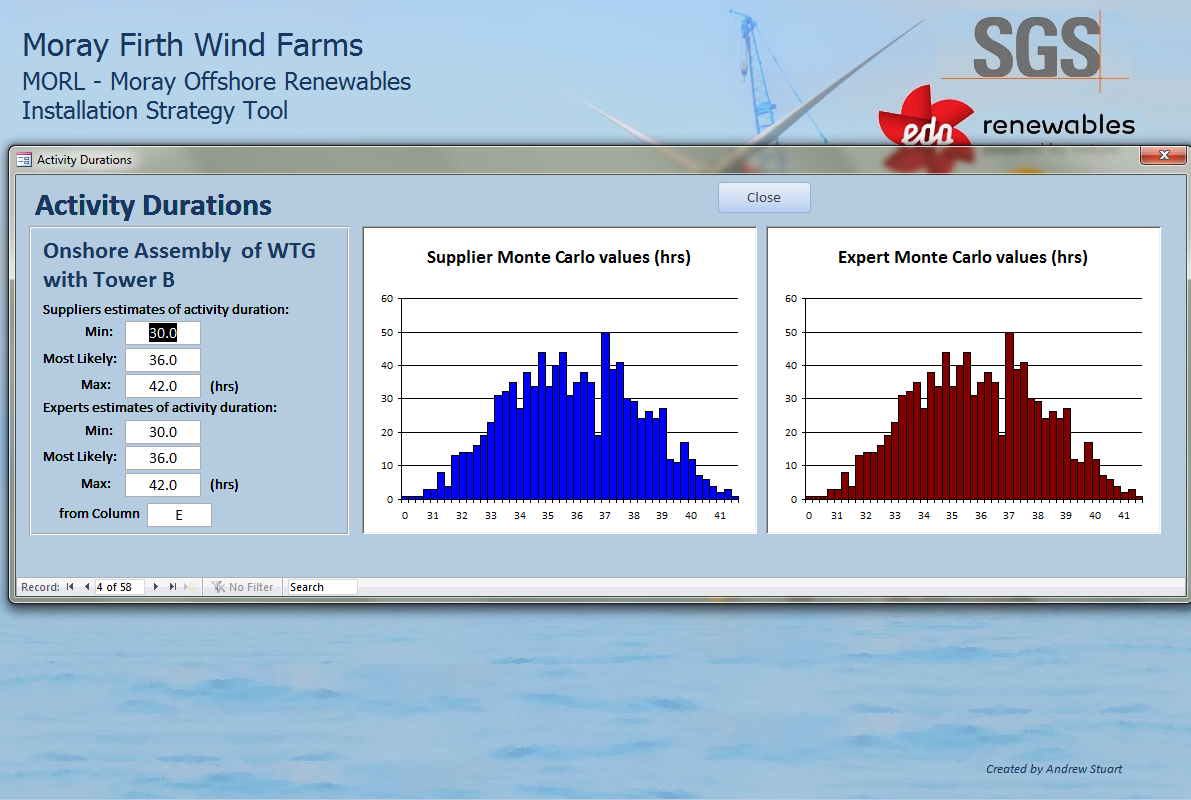
We know how long an activity *should* take - these are supplied by both the supplier and an in-house expert. We take the minimum, most-likely and maximum times and generate a 1000 point monte carlo distribution. The charts of these are on this screen.
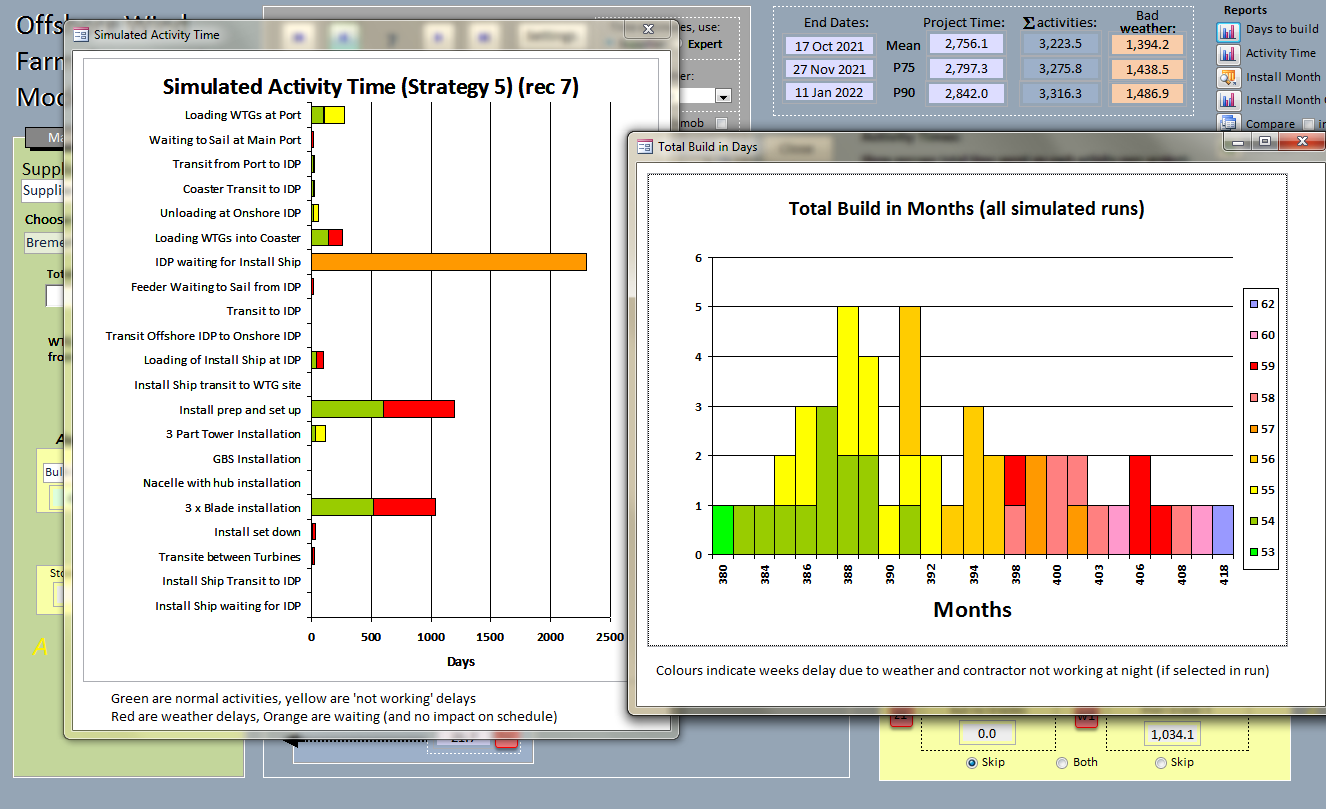
This is from a 300 turbine installation scenario but only 50 runs of the model were made, so some of the outputs are very granular. These two charts are examples of some of the graphical outputs from the model. One activity is waiting idle for a vvery long time (orange) and two acticities are showing significant weather delays.
Risk Management Tool for SGS
Office 2010 products developed between 2009 and 2011
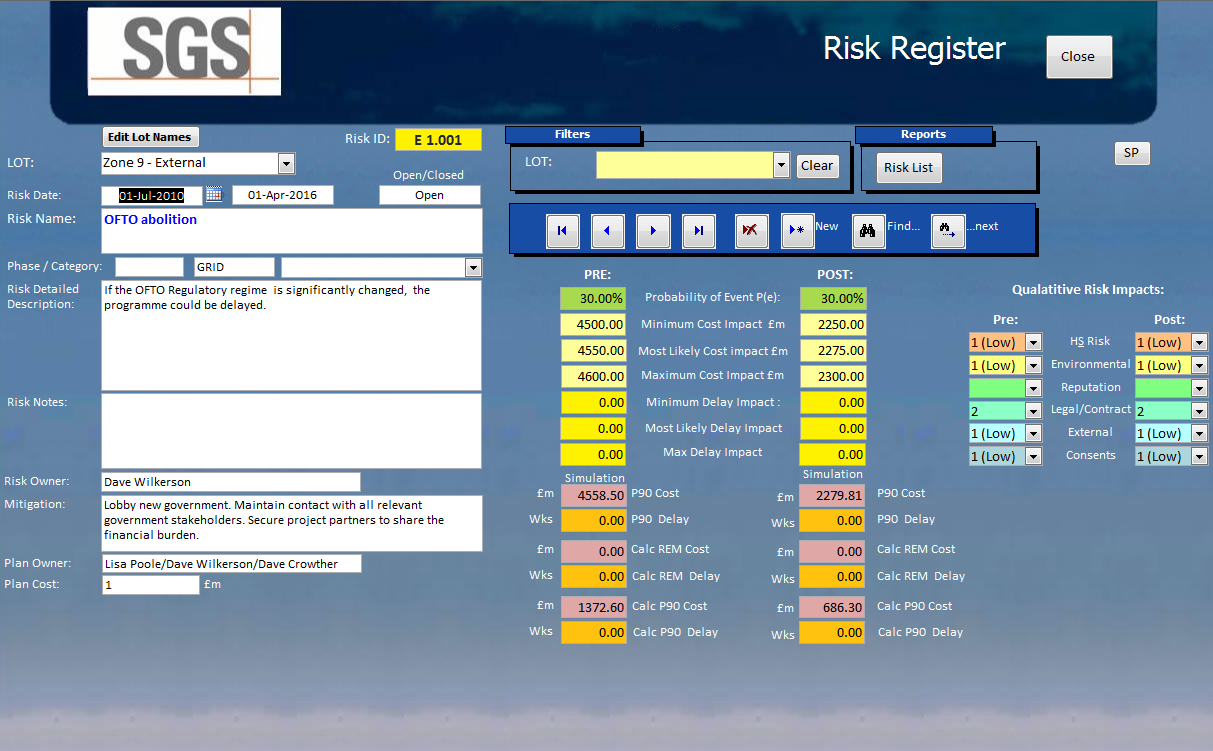
Although the Risk Register was managed in huge Excel spreadsheets my tool could import them. This srceen allowed browsing of the individual risks and changes to their parameters.
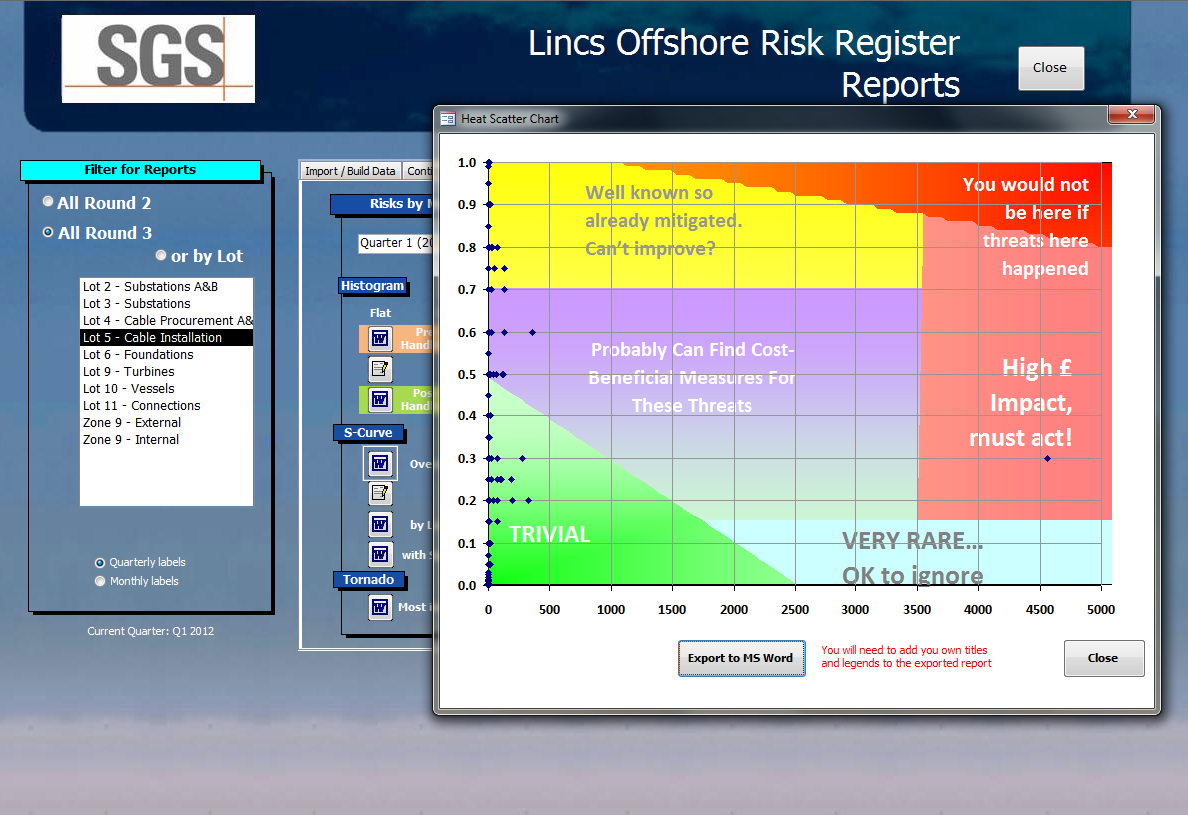
The client required a large number of different reports and the tool could produce automatically compile reports from templates (useful as the data changed each month) to producing individual charts and graphics. This is screen shot of the Heat Scatter Chart, but in addition to the traditional pie and line charts and histograms I developed my own Whisker and Gantt Charts.
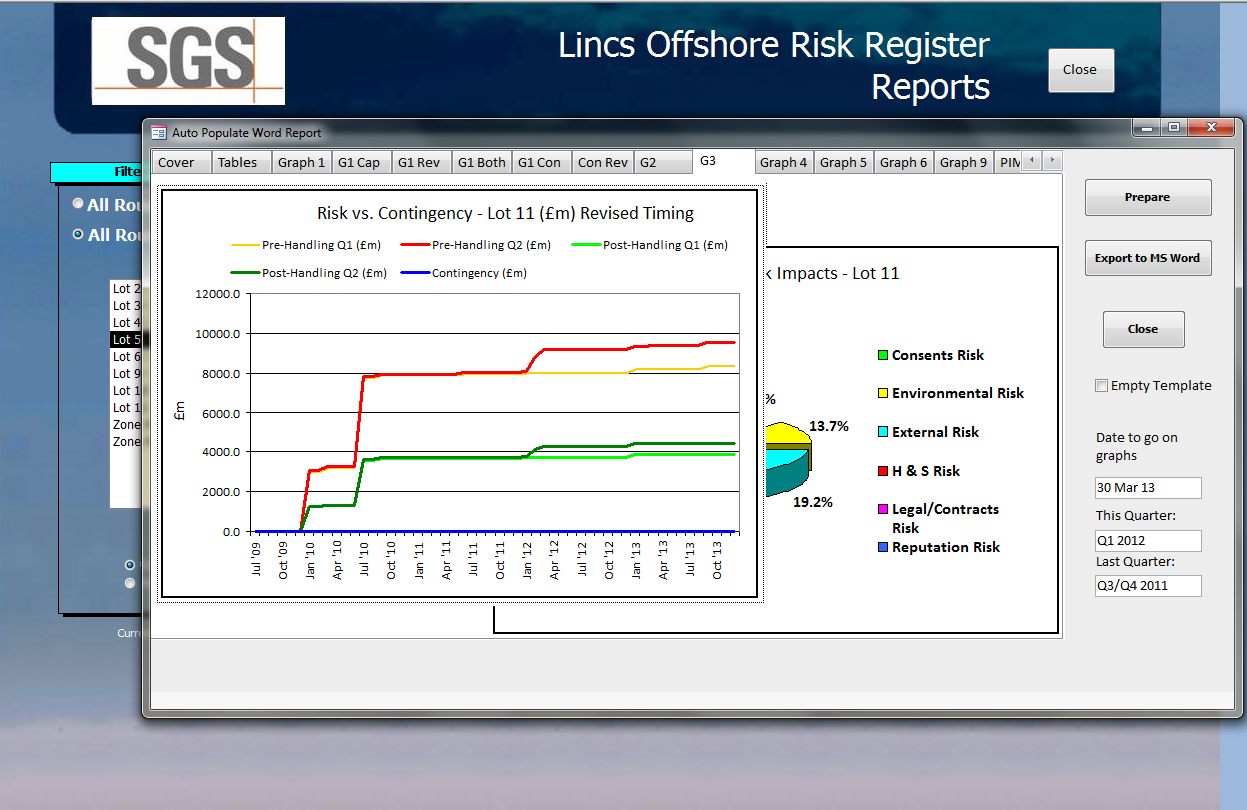
The main monthly report was built using an MS Word template with bookmarks. Access generated HTML based word tables and charts on the fly at a press of a button. Then opened the template and inserted all the data into the document. There were numerous text replacement insertions as well all managed by the database.
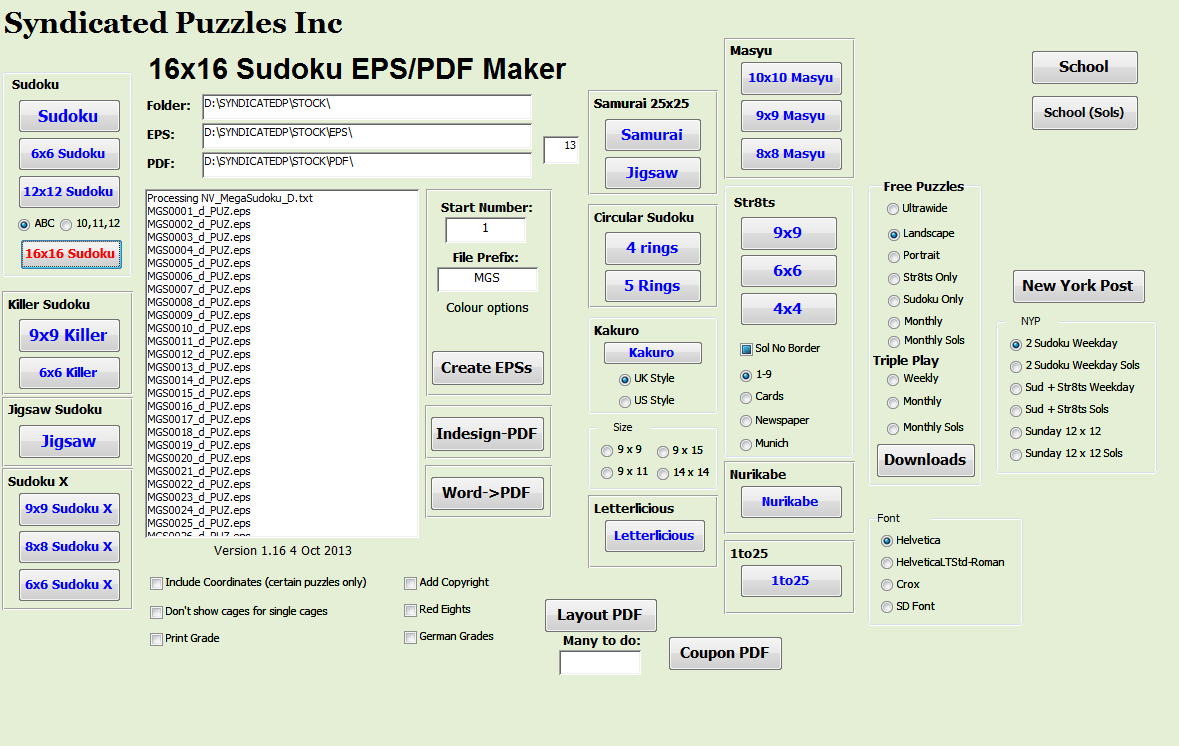
For my puzzle business I created a stock control system (partly as a web app and partly in Office). This database takes textual puzzle definitions and generates print quality EPS files. Some of those outputs are recycled into layouts and turned into PDF files. I programmatically open Abobe Indesign and manipulate the InDesign templates to insert content.
QES Project Administration Database
Office 97 and Oracle products using ODBC. Developed in 2002, 2003
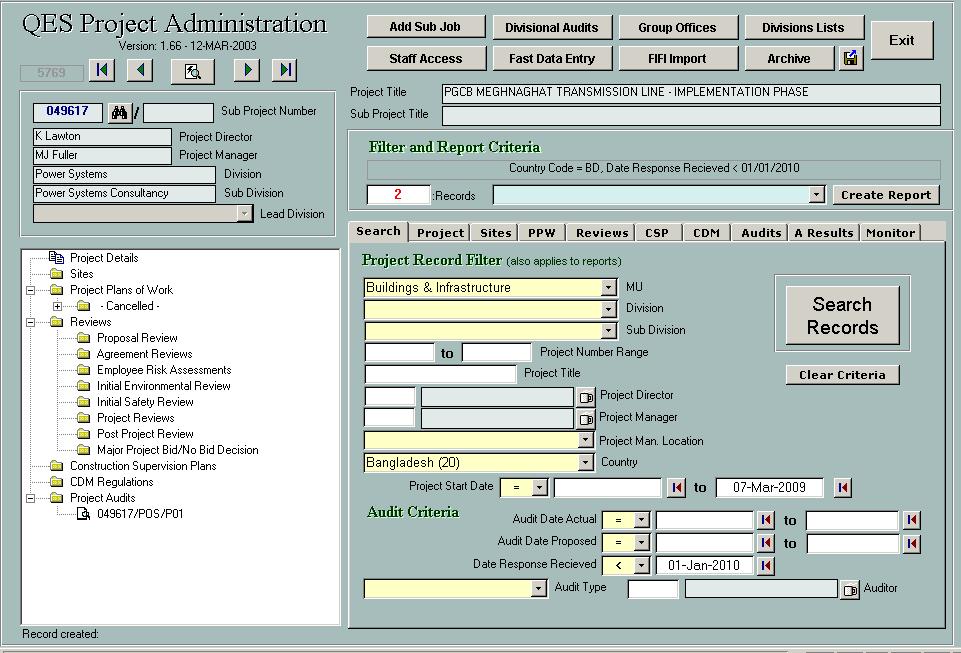
This is the main screen for QES - a division of Mott MacDonald dealing with project quality and management. There is a neat document tree in the bottom left hand corner. On the lower right is a tab control allowing access to all the child records.
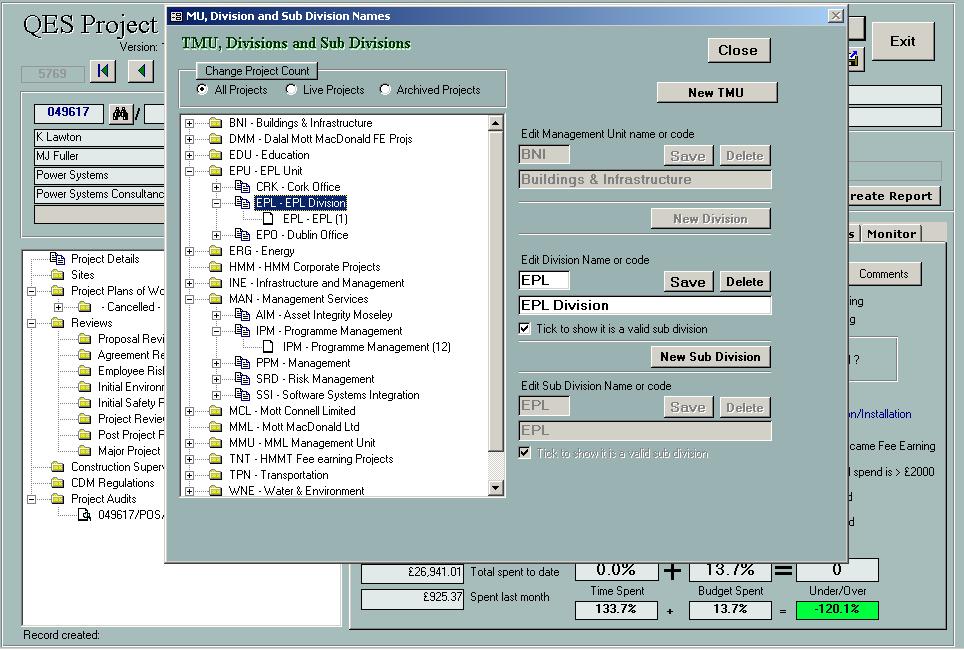
There are three layers of divisions and sub divisions within the company and this Tree Control manages them. This populates pull down menus used in data entry.
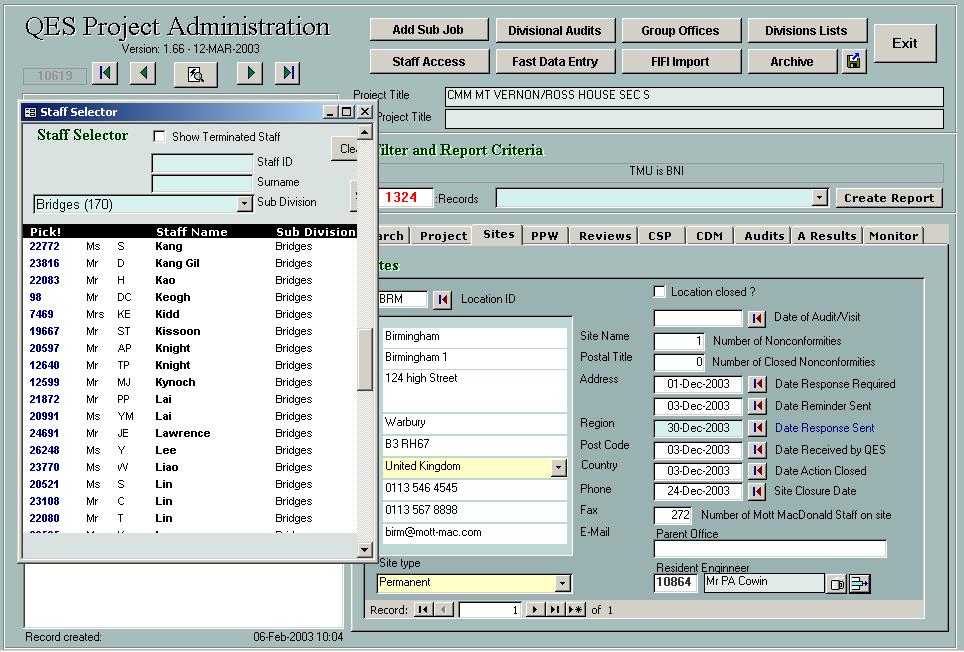
Here is a screen shot of one of the tabs dealing with sites owned by a project. The pop up on the left is for selecting a staff member which ensures that a proper record is related in the database rather than a simple name being typed in. The back end is partially access and partially Oracle. There is also a web version of the system which I also wrote.
Abu Dhabi Water Resources Database
Office 97 products developed in Abu Dhabi between 2001 and 2002
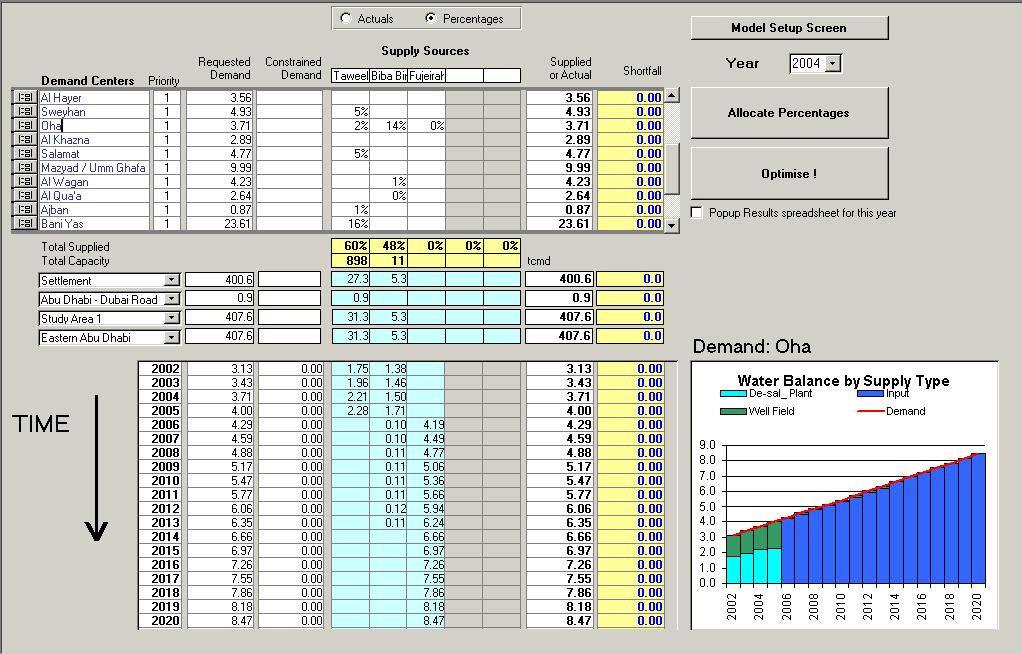
Mott-Macdonald posted me to Abu Dhabi to design a Water Resources model using Access as the database and model system. This shot shows the model interface where individual demand sites are supplied from a variety of sources - graphed over a 20 year period.
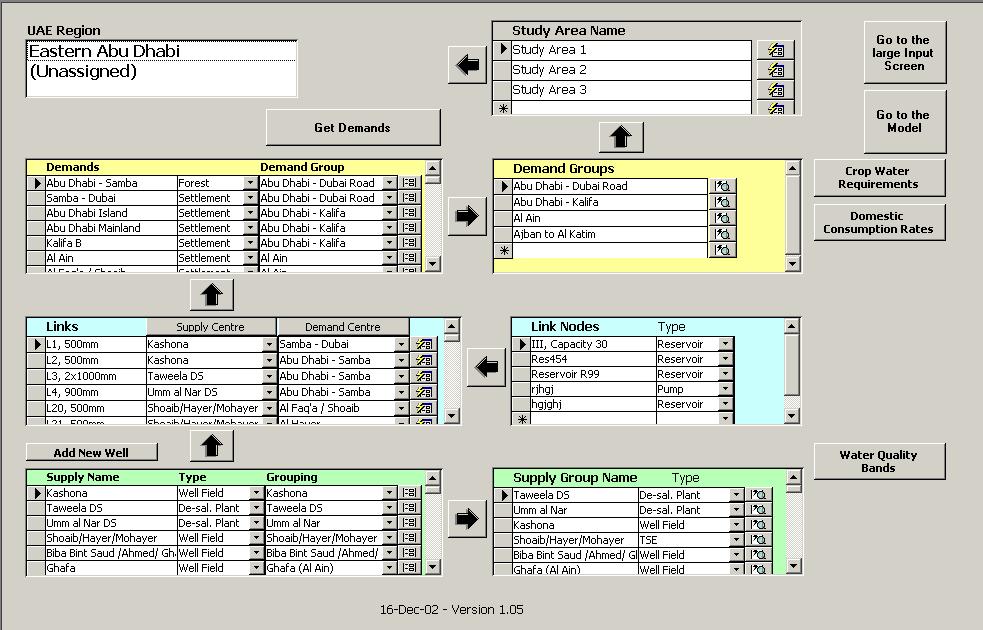
The screen displays the demands (yellow) and the supplies (green) and allows the user to join them with pipes (or links - blue). It is hierarchical and each record has its own popup for entering time-series data such as population of capacity.
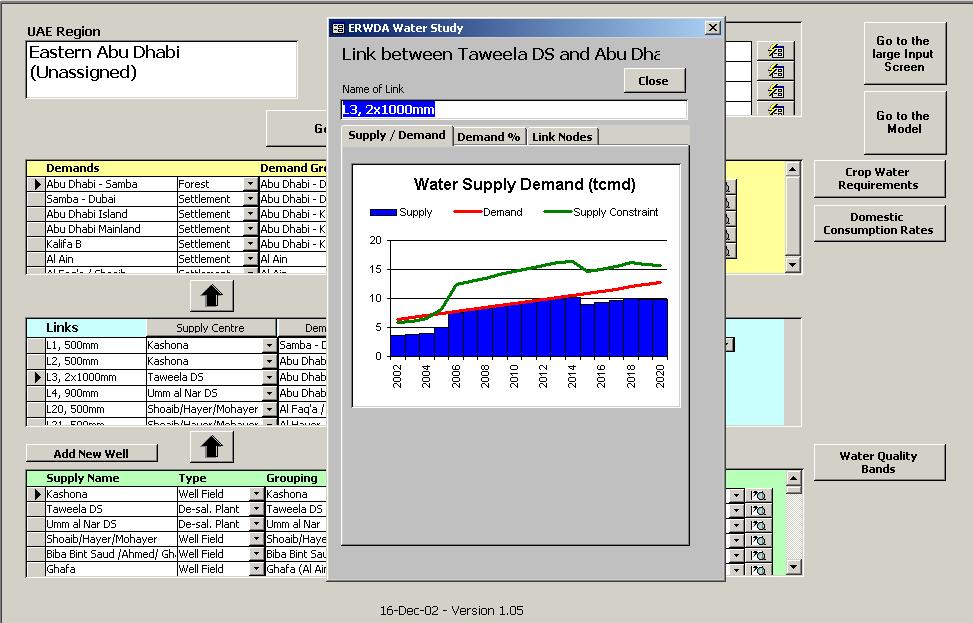
Here is one such popup for a link - it automatically tries to graph the supply and demand from the data in other records.
Risk Survey Database
Office 97 products developed in 1999
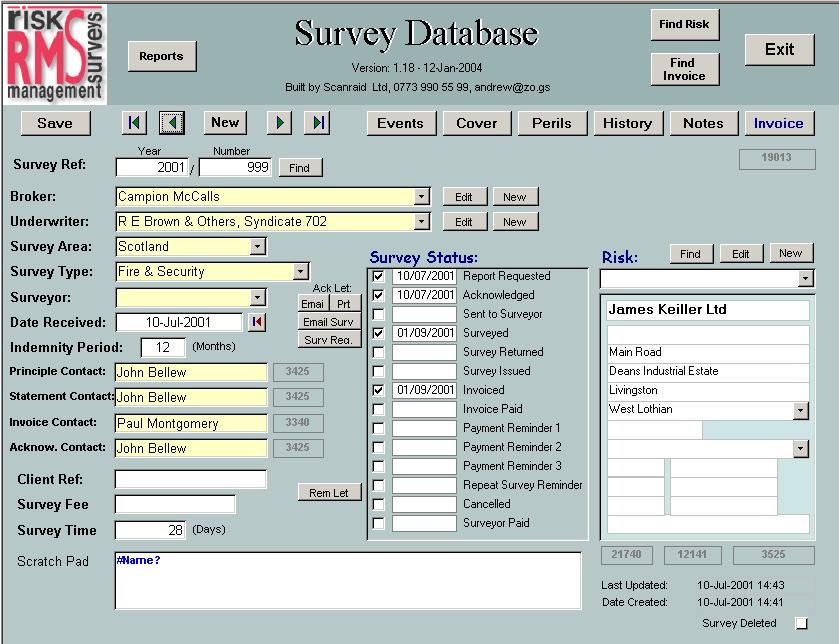
A Risk Management company based in London commissioned a web site and database from me to manage all the hundreds surveys they do each year. This is a shot of the main screen. There are tabs and buttons to many pop-ups allowing access to the child records and contact management system. There is also a web version (in ASP) to allow remote users access to the system.
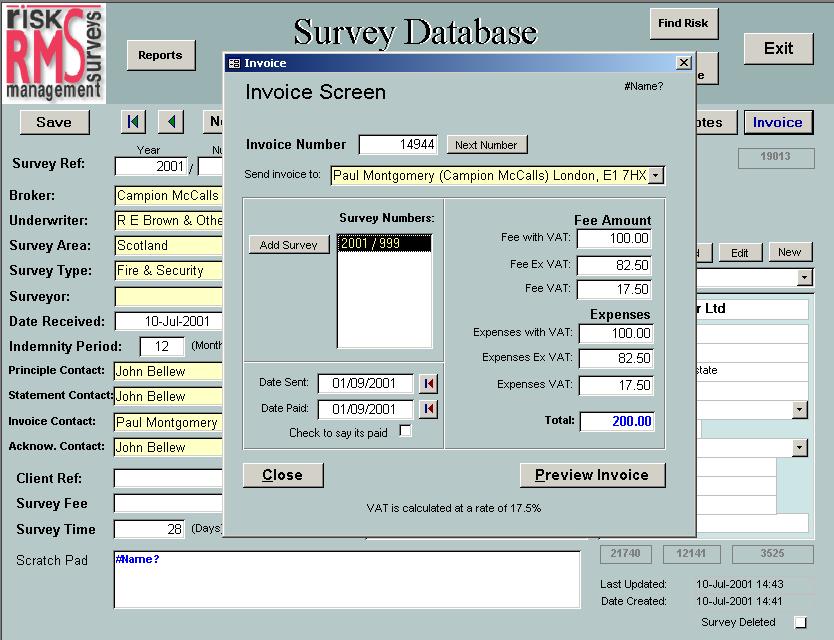
The tool allowed the surveyors complete control over the management of risks, reporting and invoicing. Here is an example popup which allows a manager to enter invoice details and create a printable invoice.
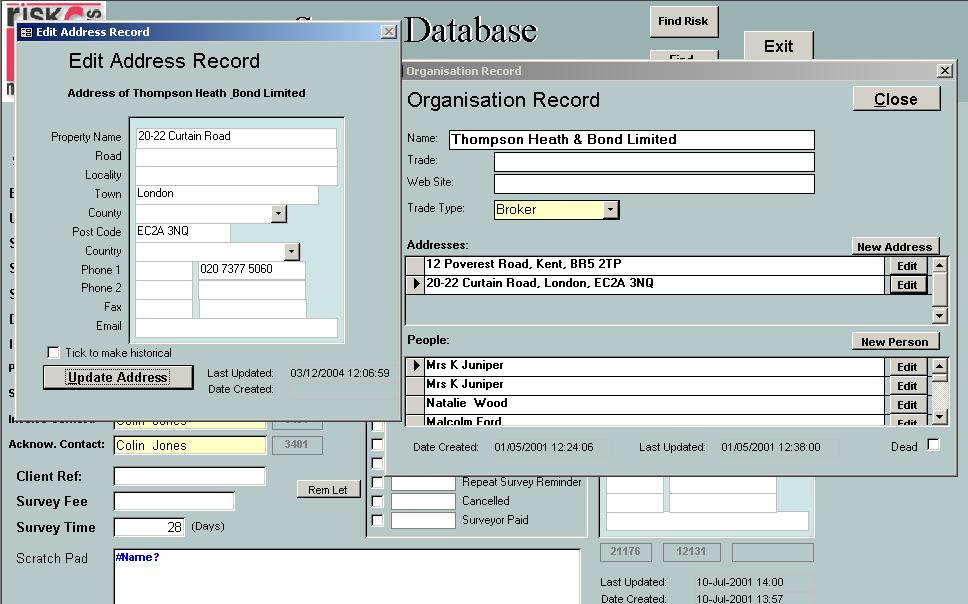
These are the pop-up screens allowing address details to be seen and edited. The original specification called for a minimum of data duplication to much of the work involved designing easy to use look ups.
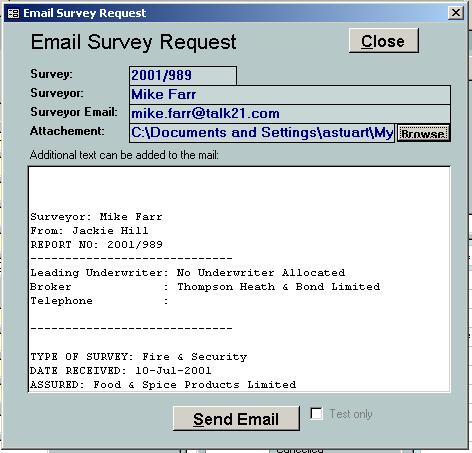
Many reports - including the surveys and invoices - need to be emailed to a client so there are screen to automate this and interface with email programs such as Exchange and Outlook.
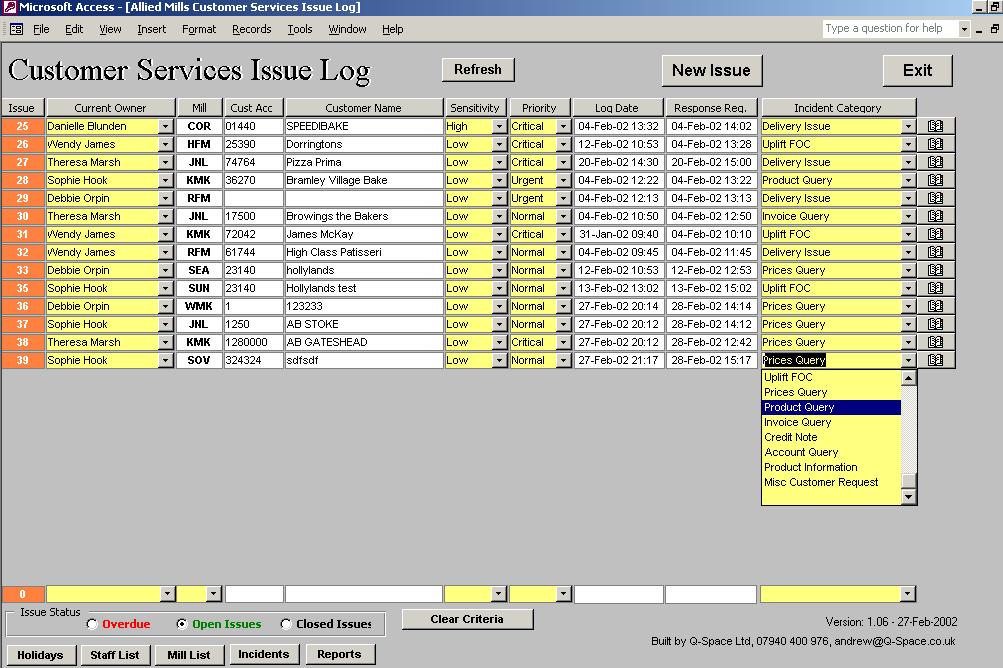
An early database from back in the day. This is a application was used by a group of employees to track issues with suppliers and customers. They have a response time and ownership policy to allow performance checking and management reports on efficiency. This is all built into the system.